This article may contain affiliate links. If you buy some products using those links, I may receive monetary benefits. See affiliate disclosure here
If your WordPress site is loading slow on the front-end, there are many ways to optimize it. Just implementing page caching and minification itself can get you a long way.
But if you want to fix a slow WordPress admin, the approach should be different. Full-page caching is not of much use here as you want to keep the admin pages dynamic.
So the only solution is to find the underlying issues that are slowing down the pages and resolve them. That's what we are going to discuss in this post.
However, there is not a quick fix or a step-by-step process that can solve all the issues. So, here I am mentioning the things that I would do if I find that my admin pages are loading slowly.
Where to Begin?
There are several parameters that affect the loading speed of a web page. For a normal front-end page, you can check the speed using a remote online tool like GTmetrix or Pingdom Tools. It helps to find out the TTFB, on-load time, and no. of requests for visitors from different locations.
In contrast, for WordPress admin pages, you have to log in to access them. Also, since you are the admin, you want to know how fast the pages are for you, not your users.
Use Chrome Developer Tools
And for that, your best friend will be the Chrome Developer Tools itself. It gives detailed insights on how a page loads on your browser, along with different metrics like TTFB, request count, DOMContentLoaded time, and many more.
So if you feel that the admin area is loading slow for you, the first thing you should do after logging in is to open the Developer Tools. For that, right-click on the page, then click Inspect, and go to the Networks Tab. Then reload the page so that Chrome displays the details of all the requests made for that page.
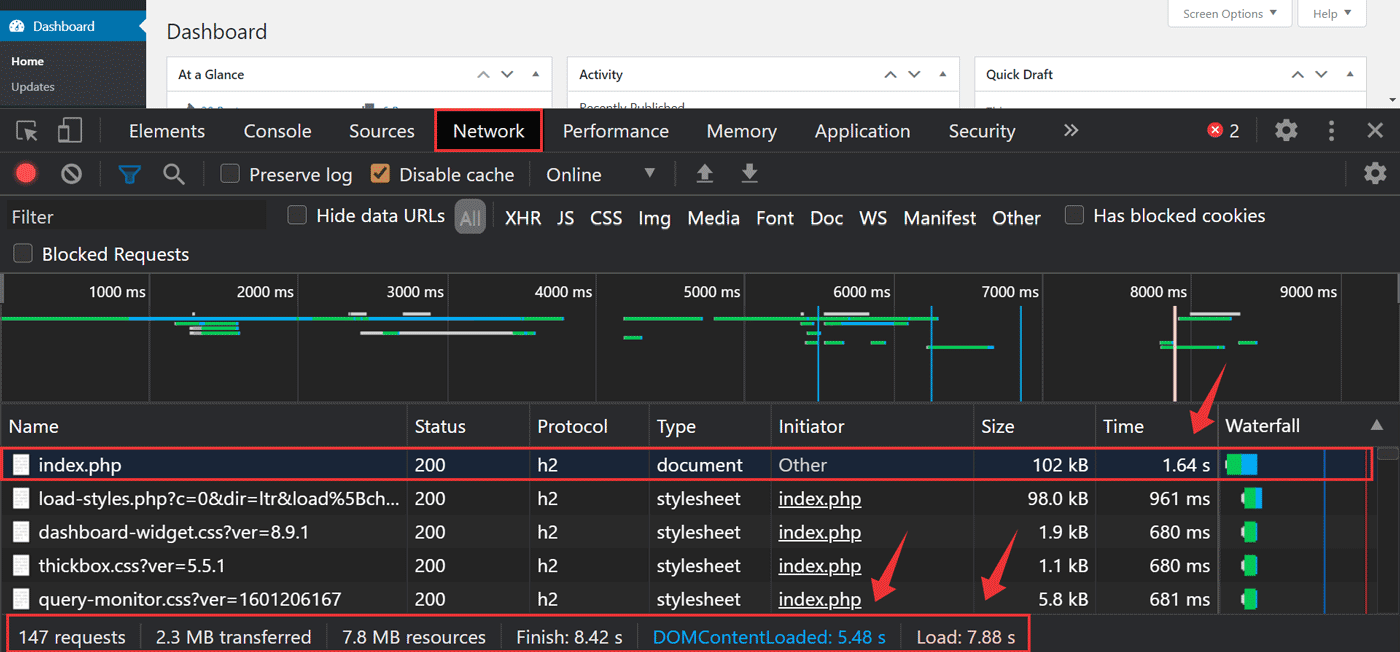
Here, we are mainly interested in the following metrics:
- Document time
- Document TTFB
- DOMContentLoaded Time
- Load Time
- No. of Requests
Remember, the no. of requests will be usually higher for backend pages. Also, these figures largely depend on your internet connection speed. So it's normal for your admin pages to load slower than your front-end pages.
In the above image, you can see that the document loaded in just 1.64s. But the total load time (7.88s) and DOMContentLoaded Time (5.48s) are higher. The primary reason is, the page contains numerous requests (147 here) in addition to the document.
In this post, we are mainly looking at the first one - document time because it is usually the major performance bottleneck. If it is slow, everything else that follows slows down as well. Here, the 1.64s loading time is not that bad. But if your's is much slower, the below points will hopefully help you.
There are several stages that constitute this loading time. Let me try to simplify it into three:
- your browser sends the request over the network to the server
- the server receives the request and generates the output after running the necessary PHP & MySQL queries
- the server sends the response (HTML document) back to your browser over the network
Hover over the Waterfall bar in Developer Tools to view a breakdown of the timings.
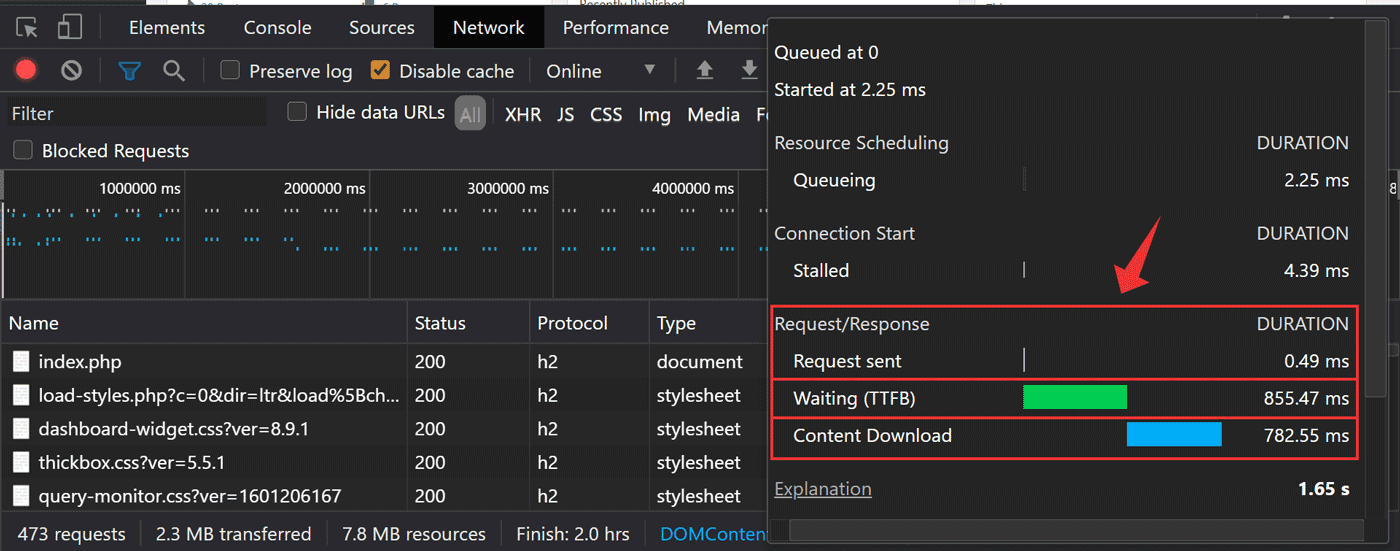
Check the TTFB, which involves the three stages I've mentioned above. Here, 855ms is not a bad TTFB. But if yours is slow, there can be two reasons:
- your server is taking a lot of time to generate the response
- slow network speed - either your's or your hosting provider's
- high latency - server location is far away from where you're checking
Usually, it's the first one - your server takes a long time to generate the responses. And there are mainly two causes for that:
- inefficient PHP or MySQL scripts used by plugins or themes
- poor web hosting / underpowered server
That's what we'll focus in the rest of the article.
Install Query Monitor Plugin
WP Query Monitor is one of the best plugins that help to analyze the processes on the server-side. In addition to showing the overall page generation time and database query time, it gives detailed info about the WordPress hooks in use, javascript, and CSS resources.
So go to Plugins > Add New, search for 'query monitor', install it, and activate the plugin.
Once the plugin is active, you'll get quick info on the admin bar at the top. Clicking on it will open a new pane at the bottom (just like Chrome Dev Tools), which shows extra details.
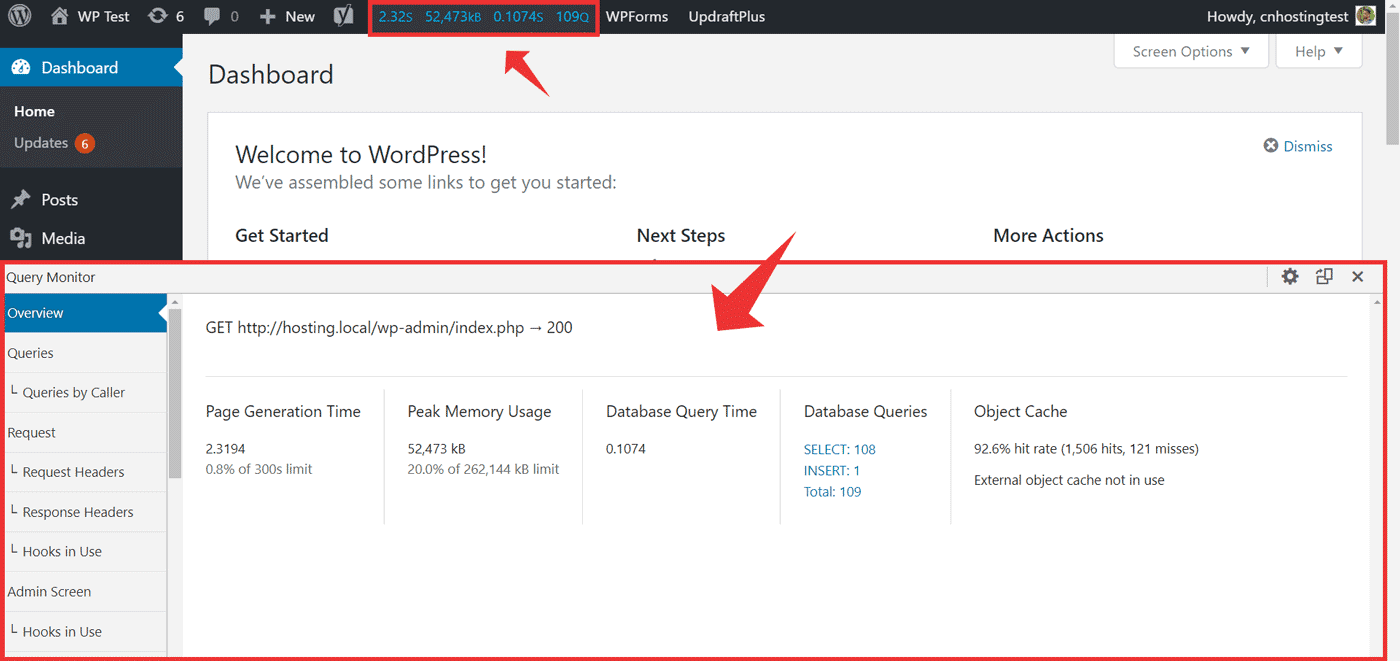
In the bottom pane, you can mainly find these three metrics:
- Page Generation Time
- Peak Memory Usage
- Database Query Time
The page generation time is a combination of database query time, and the time spent running the PHP scripts loaded by the WordPress core, plugins, and theme.
Let's discuss the things you can do to improve these figures.
1. Fix PHP Errors
Errors are one of the main culprits for a slow page generation time. They can be caused either by faulty PHP scripts or MySQL issues. Luckily, WP Query Monitor can diagnose all such things.
There are mainly four types of errors in PHP:
- Syntax errors
- Warnings
- Notices
- Fatal errors
If there are fatal or syntax errors, the page won't even load. Otherwise, for warnings and notices, the script will execute, but the page generation time can be really high.
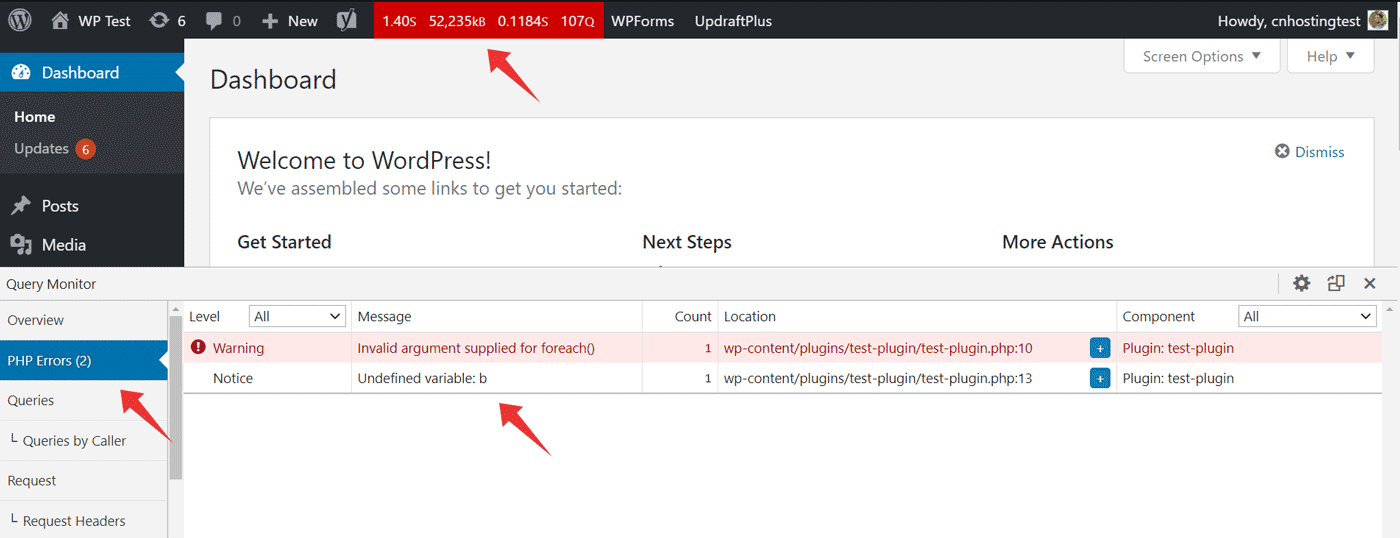
Usually, a plugin or theme will be the source of the error. If you have any such error(s), Query Monitor will turn red or yellow.
For example, in the below image, there are two errors caught by Query Monitor - a warning, and a notice. Under the Component column, you can see the plugin that caused the errors (here it shows test-plugin, as I created the errors intentionally within a custom plugin to demonstrate it here).
Instead, if it is in a plugin or a theme you've downloaded, the best way is to notify the author/developer about the error and wait for a fix. Until then, you can keep the faulty plugin/theme disabled, or use an alternative.
2. Fix Database Errors
As with PHP code, errors can also occur with database queries, as someone asked in this support thread. Again, the solution is to ask the plugin developer to release a fix.
3. Clean Up Bloated Database
If your site has been around for a while, chances are that the database is bloated with orphaned tables, unwanted revisions, spam comments, and so on.
Check the database query time next to the page generation time in the Overview tab of Query Monitor. If it's high, a bloated database can be the reason.
For example, WordPress by default creates a revision entry whenever you update a post. And if you have been regularly updating the posts for a while, there can be hundreds of unnecessary revisions in the database. It can make the query time higher on the post list and edit pages. The effect will be noticeable especially in shared hosting environments.
The fix is to clean up the database from time to time. There are a few plugins like WP Sweep, which can delete revisions, remove orphaned tables, spam, etc., thereby improving the database performance.
4. Remove Slow WordPress Plugins
Plugins don't necessarily slow down a site. But poorly coded plugins or plugins that don't follow the best practices can impact your site's performance seriously in multiple ways:
- running resource-intensive scripts
- making too many database queries than required
- loading additional resources like CSS, JS, and images
Not only the admin area, but it can also have a serious effect on the front-end as well.
Earlier, there was a plugin call Plugin Performance Profiler, which was quite helpful in identifying slow plugins. Unfortunately, it hasn't been updated for a while. There are some alternatives, but none of them could really replace the functionalities provided by that plugin.
So for now, the best way is to rely on Query Monitor and Chrome tools. Or there is another plugin called F12-Profiler, but it has fewer than a thousand installations as of writing this post.
Also, you can try activating and deactivating the plugins one by one to find out which one is noticeably slowing down your site.
Authority Hacker has a list of slow plugins that are known to degrade a site's performance. You don't need to avoid all of them. However, if your site is using a couple of them, you might want to rethink.
5. Upgrade to PHP 7
Most decent WordPress hosting providers now support PHP 7.x. As of writing this post, 7.4 is the latest version. For any reason, if your site is still running on PHP 5.6 or older versions, it's high time to upgrade.
According to a benchmarking test published by Kinsta, PHP 7.4 is more than 3x faster than PHP 5.6. Most cPanel-based web hosts allow you to select the PHP version. If you cannot find the setting, contact the hosting support to perform the upgrade.
6. Migrate to a Better Hosting Provider
Sometimes, even after doing all the possible things on your part, the site still loads slowly. In that case, the problem might be with your hosting provider. Some providers, especially shared hosts often stuff too many clients on a single server, which can result in poor performance.
But how to isolate if it's a hosting issue?
One way is to install a fresh WordPress site and do some tests. Perform a simple load test (using a tool like loader.io). These tools send several simultaneous visitors to your site for a period of time (usually one minute). Start with a small number of users (<10) and gradually increase the count.
If most of the tests fail or if there are too many timeout errors, the hosting plan you're checking is not great in handling simultaneous visitors.
And if your host cannot handle the load, that means it is not powerful enough, especially if you are running WooCommerce or forum sites where users can signup and interact with your site. For the same reason, admin pages may also face performance issues.
These days, cloud VPS gives the best performance for the price. DigitalOcean, Vultr, and Linode are examples. It can be a little costlier than shared hosting. But the better reliability and uptime figures make it worth the extra money. Also, there are several tools and control panels you can use to manage your VPS instance.
Or else, if you want a managed cloud hosting, which allows managing your VPS like shared hosting, Cloudways is one provider that has worked well for me so far.
Slow Editor? Try Disabling Browser Extensions
Another thing that often bugs me these days is the slow post editor. Although the new Gutenberg editor gives lots of flexibility while crafting content, it can be annoyingly 'lagging' at times. The problem has occurred a couple of times while I am typing this post as well. Letters take a while to appear after pressing the keys.
When I checked the Performance Monitor in Chrome Tools, I found that the CPU usage is quite high whenever this happens.
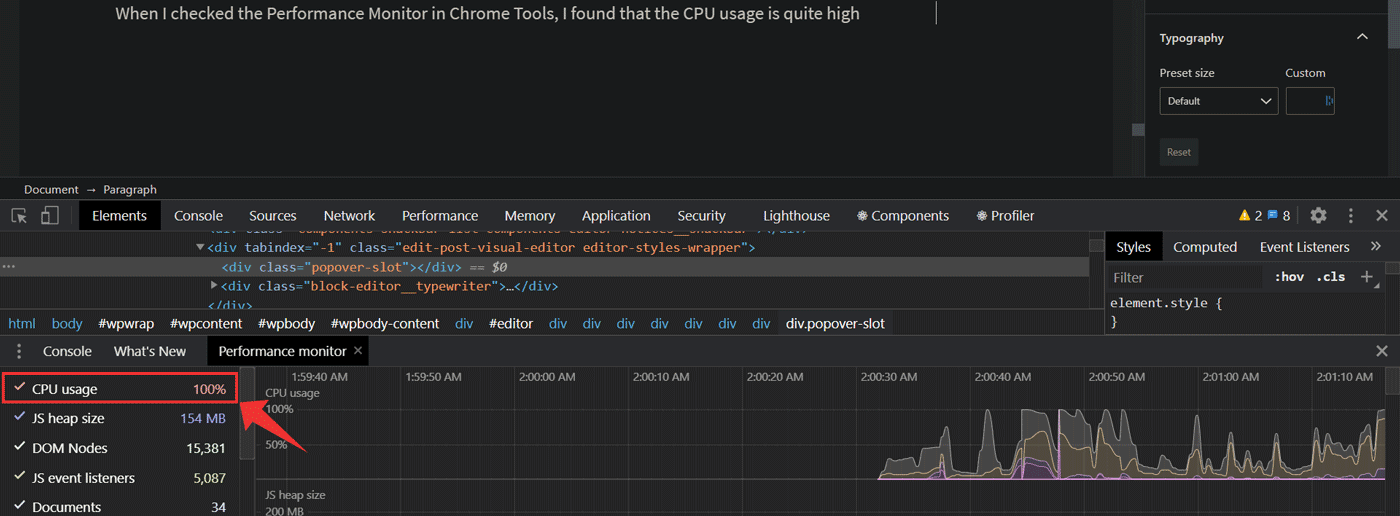
Disabling a few browser extensions including Grammarly and Dark Reader reduced the issue to an extent. And in the incognito window, there was no problem at all. So my conclusion is that the issue is a combined effect of browser extensions and WordPress editor running resource-heavy tasks.
Searching on the forum, I found that I am not the only one experiencing the same issue [source].
So, these are the things you can do if your editor is laggy:
- try disabling browser extensions (especially the ones that run as you type, like Grammarly), or open in an incognito window
- ensure WordPress and other plugins are up-to-date
- if it's still slow, try from a different device
- lastly, if none of them fixe the issue, switch back to the classic editor
Conclusion
So, we have discussed a few possibilities that can slow down the WordPress admin. Along with that, I have also mentioned the ways you can tackle each of them.
Usually, it turns out to be a plugin or a couple of plugins, that is causing the slowdown. Query Monitor is your best friend in isolating such plugin(s). And most of the time, deactivating them or finding alternatives can fix the issue.
If I've missed any crucial point, or if none of the tips worked for you, feel free to shoot your query in the comments section.